Metrics for quantifying how much different threats contribute to red lists of species and ecosystems
| dc.contributor.author | Sandvik, Hanno | |
| dc.contributor.author | Pedersen, Bård | |
| dc.date.accessioned | 2023-12-15T09:29:56Z | |
| dc.date.available | 2023-12-15T09:29:56Z | |
| dc.date.created | 2023-05-05T13:14:19Z | |
| dc.date.issued | 2023 | |
| dc.identifier.citation | Conservation Biology. 2023, 37 . | en_US |
| dc.identifier.issn | 0888-8892 | |
| dc.identifier.uri | https://hdl.handle.net/11250/3107705 | |
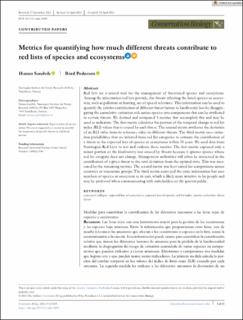
| dc.description.abstract | Red lists are a crucial tool for the management of threatened species and ecosystems. Among the information red lists provide, the threats affecting the listed species or ecosystem, such as pollution or hunting, are of special relevance. This information can be used to quantify the relative contribution of different threat factors to biodiversity loss by disaggregating the cumulative extinction risk across species into components that can be attributed to certain threats. We devised and compared 3 metrics that accomplish this and may be used as indicators. The first metric calculates the portion of the temporal change in red list index (RLI) values that is caused by each threat. The second metric attributes the deviation of an RLI value from its reference value to different threats. The third metric uses extinction probabilities that are inferred from red list categories to estimate the contribution of a threat to the expected loss of species or ecosystems within 50 years. We used data from Norwegian Red Lists to test and evaluate these metrics. The first metric captured only a minor portion of the biodiversity loss caused by threats because it ignores species whose red list category does not change. Management authorities will often be interested in the contribution of a given threat to the total deviation from the optimal state. This was measured by the remaining metrics. The second metric was best suited for comparisons across countries or taxonomic groups. The third metric conveyed the same information but uses numbers of species or ecosystem as its unit, which is likely more intuitive to lay people and may be preferred when communicating with stakeholders or the general public. | en_US |
| dc.language.iso | eng | en_US |
| dc.rights | Navngivelse 4.0 Internasjonal | * |
| dc.rights.uri | http://creativecommons.org/licenses/by/4.0/deed.no | * |
| dc.subject | ecosystem collapse | en_US |
| dc.subject | expected loss of ecosystems | en_US |
| dc.subject | expected loss of species | en_US |
| dc.subject | red list index | en_US |
| dc.subject | species extinction | en_US |
| dc.subject | threat factor | en_US |
| dc.title | Metrics for quantifying how much different threats contribute to red lists of species and ecosystems | en_US |
| dc.title.alternative | Metrics for quantifying how much different threats contribute to red lists of species and ecosystems | en_US |
| dc.type | Peer reviewed | en_US |
| dc.type | Journal article | en_US |
| dc.description.version | publishedVersion | en_US |
| dc.rights.holder | © 2023 The Authors | en_US |
| dc.subject.nsi | VDP::Økologi: 488 | en_US |
| dc.subject.nsi | VDP::Ecology: 488 | en_US |
| dc.source.pagenumber | 13 | en_US |
| dc.source.volume | 37 | en_US |
| dc.source.journal | Conservation Biology | en_US |
| dc.source.issue | 5 | en_US |
| dc.identifier.doi | 10.1111/cobi.14105 | |
| dc.identifier.cristin | 2145840 | |
| dc.relation.project | Norges forskningsråd: 160022/F40 | en_US |
| cristin.ispublished | true | |
| cristin.fulltext | original | |
| cristin.qualitycode | 2 |
Tilhørende fil(er)
Denne innførselen finnes i følgende samling(er)
-
Publikasjoner fra CRIStin - NINA [2317]
-
Scientific publications [1345]
Vitenskapelige artikler, kapitler og monografier i Open Access.

Med mindre annet er angitt, så er denne innførselen lisensiert som Navngivelse 4.0 Internasjonal